|
|
|
|
|
|
|
|
|
EEG - Loading Data from PhysioNet |
| Tags | open☁load☁eeg☁physionet |
PhysioNet is a website, which offers free access to its database with a range of various physiologic signals such as EEG recordings for different setups.
| ☌ This Jupyter Notebook is a guide on how to load EEG data from Physionet"s Database from the new website and explains how to load and plot the recordings in Python for further examination or comparison of acquired data with PLUX sensors. |
New Website: https://alpha.physionet.org/ - for download of single .edf files of recordings or as a zip file
1. New Website:
1.1 Database with experiment protocols:
A - To download the desired data recordings on the new website, select "Data" to reach the Database of PhysioNet:
B - Choose the desired Database and recordings, in this case "Neuroelectric" and "EEG Motor Movement / and Imagery Datset":


1.2 Experiment Protocols:
Once the desired dataset is selected, the examination protocol will open to comprehend each file to each subject / task / electrode position.
In this case there are several experimental runs, each representing one file in the folder of one subject.


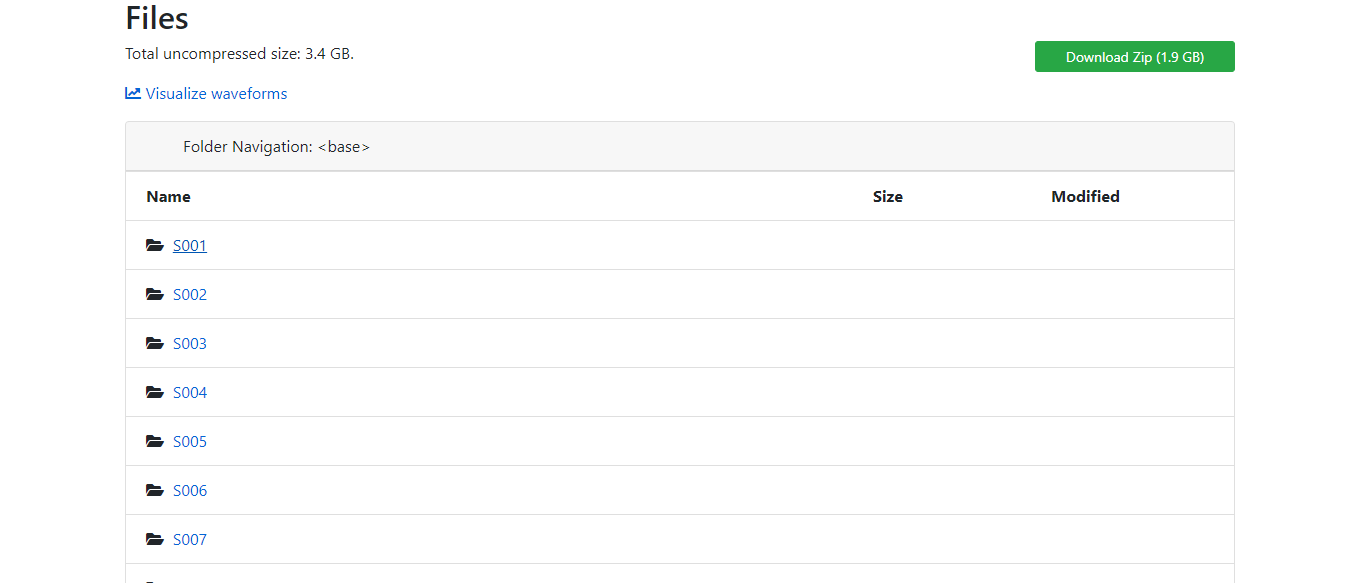
1.3 File Download:
Either choose one Subject file containing a file for each task which contains a matrix with a row for each electrode or download all data as a zip file. You can also choose one subject and load all task files in a zip file.
The data will be downloaded as .edf files.

1.4 File structure for EEG:
Check out the PDF figure to see the electrode positions corresponding to the rows in the matrix. As mentioned on the website, electrode 1 corresponds to row 0. In this example electrode
O1 (no. 61)
will be plotted.

2 - Load and plot data
2.1 - Importation of the needed packages
# Biosignalsnotebooks python package
import biosignalsnotebooks as bsnb

# Scientific packages
from pyedflib import EdfReader
from numpy import zeros, arange
2.2 - Loading of acquired EEG data
The EEG data of one specific task and one test person is stored in a single edf file, where each row corresponds to an electrode of the 10-20 system. In the following, all electrode data as well as one specific electrode data (O1) is stored and plotted:
A - Define the path of the downloaded file (Physionet EEG recording: Task 2 - eyes closed, Test person: 1)
For our particular case we defined a relative path of our biosignalsnotebooks project.#define relative file path for Physionet EEG recording: Task 2 - eyes closed, Test person: 1
relative_file_path = '../../signal_samples/S001R02.edf'
#define the row of the electrode no.
electrode_row = 60
B - Read the .edf file and prepare the data structure "data" where the file content will be stored
# Read the edf file and store the data
f = EdfReader(relative_file_path)
n = f.signals_in_file
signal_labels =  f.getSignalLabels()

# Prepare the data structure responsible for storing the .edf file content.
data = zeros((n,f.getNSamples()[0]))
C - Read the signal stored in each row of data
#read the signal of all rows
for i in arange(n):
     data[i, :] = f.readSignal(i)
D - Storage of specific data and execution of the needed procedures to close our .edf file
# store specific electrode data
data_electrode = data[electrode_row]

#store all data
data_eeg = data

#close the edf file
f._close()
del f
The plot illustrates the raw data of all electrodes according to the 10-20 system for the Baseline Test 2 (60 seconds eyes closed - Test person 1):
The time axis is generated for the plot of the single electrode:
#generate time axis for single electrode plot
sr=160 #sampling rate PhysioNet
time = bsnb.generate_time(data_electrode, sr)
The Figure shows the plot of a single electrode (O1) for the above mentioned Baseline test:
For more information on EEG signal processing a set of dedicated Notebooks is currently available:
EEG - Alpha band extraction
![]() and
Digital Filtering - EEG
and
Digital Filtering - EEG
![]() and for information regarding electrode positioning a third Notebook was also developed:
EEG - Electrode placement
and for information regarding electrode positioning a third Notebook was also developed:
EEG - Electrode placement
![]() .
.
Periodically check our main page or newsletter for more details about the publication timeline !
This Jupyter Notebook is a guide through the new as well as the old database of PhysioNet in order to simplify the download and search of specific physiological recordings such as EEG. It also illustrated how to load and plot the recordings in python.
We hope that you have enjoyed this guide.
biosignalsnotebooks
is an environment in continuous expansion, so don"t stop your journey and learn more with the remaining
Notebooks
![]() !
!