Rock, Paper or Scissor Game - Train and Classify [Volume 4]
Difficulty Level:
Tags train_and_classify☁machine-learning☁features☁train☁nearest-neighbour

Previous Notebooks that are part of "Rock, Paper or Scissor Game - Train and Classify" module

Following Notebooks that are part of "Rock, Paper or Scissor Game - Train and Classify" module

After the previous three volumes of the Jupyter Notebook dedicated to our "Classification Game", we are reaching a decisive stage: Training of Classifier .
Currently, as demonstrated in the previous volume , all the training data (examples and respective features) are ready to be applied to a classification algorithm.
The choice of classification algorithm resulted in the selection of k-Nearest Neighbour classifier.
On current Jupyter Notebook it will be described relevant steps to achieve our goal of training a k-Nearest Neighbour classifier.


Starting Point (Setup)

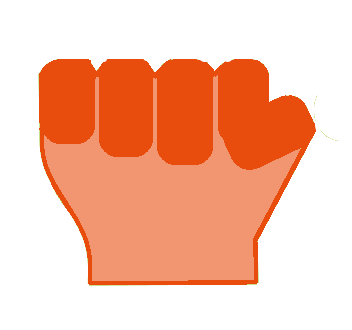
List of Available Classes:

  1. "No Action" [When the hand is relaxed]
  2. "Paper" [All fingers are extended]
  3. "Rock" [All fingers are flexed]
  4. "Scissor" [Forefinger and middle finger are extended and the remaining ones are flexed]

Paper Rock Scissor

Acquired Data:

  • Electromyography (EMG) | 2 muscles | Adductor pollicis and Flexor digitorum superficialis
  • Accelerometer (ACC) | 1 axis | Sensor parallel to the thumb nail (Axis perpendicular)

Protocol/Feature Extraction

Extracted Features

Formal definition of parameters
☝ | Maximum Sample Value of a set of elements is equal to the last element of the sorted set

☉ | $\mu = \frac{1}{N}\sum_{i=1}^N (sample_i)$

☆ | $\sigma = \sqrt{\frac{1}{N}\sum_{i=1}^N(sample_i - \mu_{signal})^2}$

☌ | $zcr = \frac{1}{N - 1}\sum_{i=1}^{N-1}bin(i)$

☇ | $\sigma_{abs} = \sqrt{\frac{1}{N}\sum_{i=1}^N(|sample_i| - \mu_{signal_{abs}})^2}$

☍ | $m = \frac{\Delta signal}{\Delta t}$

... being $N$ the number of acquired samples (that are part of the signal), $sample_i$ the value of the sample number $i$, $signal_{abs}$ the absolute signal, $\Delta signal$ is the difference between the y coordinate of two points of the regression curve and $\Delta t$ the difference between the x (time) coordinate of the same two points of the regression curve.

... and

$bin(i)$ a binary function defined as:

$bin(i) = \begin{cases} 1, & \mbox{if } signal_i \times signal_{i-1} \leq 0 \\ 0, & \mbox{if } signal_i \times signal_{i-1}>0 \end{cases}$


Feature Selection

Intro
With Feature Selection we will start to use the resources contained inside an extremely useful Python package: scikit-learn

Like described before, Feature Selection is intended to remove redundant or meaningless parameters which would increase the complexity of the classifier and not always translate into an improved performance. Without this step, the risk of overfitting to the training examples increases, making the classifier less able to categorize a new testing example.

There are different approaches to feature selection such as filter methods or wrapper methods .

In the first method ( filter methods ), a ranking will be attributed to the features, using the Pearson correlation coefficient to evaluate the impact that the feature under analysis has on the target class of the training example, or the Mutual Information parameter which defines whether two variables convey shared information.

The least relevant features will be excluded and the classifier will be trained later (for a deeper explanation, please, visit the article of Girish Chandrashekar and Ferat Sahin at ScienceDirect ).

The second methodology ( wrapper methods ) is characterised by the fact that the selection phase includes a classification algorithm, and features will be excluded or selected according to the quality of the trained classifier.

There are also a third major methodology applicable on Feature Selection , including the so called embedded methods . Essentially this methods are a combination of filter and wrapper , being characterised by the simultaneous execution of Feature Selection and Training stages.

One of the most intuitive Feature Selection methods is Recursive Feature Elimination , which will be used in the current Jupyter Notebook .

Essentially the steps of this method consists in:

  1. Original set of training examples is segmented into multiple ($K$) subsets of training examples and test examples
  2. For each one of the $K$ subsets of training/test examples:
    1. The training examples are used for training a "virtual" classifier (for example a Support Vector Machine )
    2. The test examples are given as inputs of the trained classifier and the "virtual" classifier quality is estimated
  3. At this point we can estimate the average quality of the $K$ "virtual" classifiers and know the weight of each feature on the training stage
  4. The feature with a smaller weight is excluded
  5. Repetition of steps 1 , 2 and 3 until only remains one feature
  6. Finally, when the "feature elimination" procedure ends, the set of features that provide a "virtual" classifier with the best average quality (step 2 ) define the relevant features to be used during our final training stage

k-Nearest Neighbour Classifier

Brief Intro
Following a "Cartesian Logic" each training example is formed by a set of features (in our case we have 20 training examples and each training example is composed by 8 features). Each feature can be viewed as a dimension, so, the training example would be reduced to a 8th dimensional point on the Cartesian Coordinate System .
Thus, the training stage of a Jupyter Notebook classifier is really simple, consisting in filling the Cartesian Coordinate System with all the training examples/training points.
For the standard Nearest Neighbour , when a test example is given as input of the classifier, the returned result/class will be the class of the training example nearest to our new test example.
On the improved k-Nearest Neighbour classifier will be selected the $k$ nearest training points of test example. By a voting mechanism the returned class will be the one that has more training examples inside the $k$ set.
The distance between training points can be estimated through the Euclidean Norm :

$||xy|| = \sqrt{\sum_{i=1}^N (x_{dim\,i} - y_{dim\,i})^2}$
... being $||xy||$ the Euclidean distance between two $N$ dimensional points, $x_{dim\,i}$ is the value of coordinate $dim\,i$ of point $x$ while $y_{dim\,i}$ is the value of coordinate $dim\,i$ of point $y$.

0 - Import of the needed packages for a correct execution of the current Jupyter Notebook

In [1]:
# Python package that contains functions specialized on "Machine Learning" tasks.
from sklearn.preprocessing import normalize
from sklearn.neighbors import KNeighborsClassifier

# biosignalsnotebooks own package that supports some functionalities used on the Jupyter Notebooks.
import biosignalsnotebooks as bsnb

# Package containing a diversified set of function for statistical processing and also provide support to array operations.
from numpy import array

This step was done internally !!! For now don"t be worried about that.

1 - Loading of the dictionary created on Volume 3 of "Classification Game" Jupyter Notebook , containing the selected features

This dictionary is formed by two levels:

  • Level 1 | Keys: "features_list_final" and "class_labels"
  • Level 2 | Lists with 20 entries (1/training example)
  • "features_list_final" >>> 20x8 list containing an entry for each training example (20) and the respective features (8)
    "class_labels" >>> Each entry of the list contains the number of the class to which the training example belongs
In [2]:
# Package dedicated to the manipulation of json files.
from json import loads

# Specification of filename and relative path.
relative_path = "/signal_samples/classification_game/features"
filename = "classification_game_features_final.json"

# Load of data inside file storing it inside a Python dictionary.
with open(relative_path + "/" + filename) as file:
    features_dict = loads(file.read())
In [3]:
from sty import fg, rs
print(fg(98,195,238) + "\033[1mDict Keys\033[0m" + fg.rs + " divides training example in its features and class label")
print(features_dict)
Dict Keys divides training example in its features and class label
{'features_list_final': [[0.031925374985616504, 0.9101009161769645, 0.025742998777144244, 0.054839376533556014, 0.04452308179859323, 0.011888115551701333, 0.256449422946368, 0.04658795189958139], [0.030444280899922307, 1.0, 0.024902435415904818, 0.0444578577459767, 0.04455255845830009, 0.01332879957443708, 0.2620502376103191, 0.05911564915857292], [0.07219342081806593, 0.43362888324789295, 0.0525447490181641, 0.027330949288138777, 0.03056818341764522, 0.021078178057380218, 0.4266802443991853, 0.014193699889898955], [0.049330390130518584, 0.6308965884168416, 0.03663197053067692, 0.06907079457939581, 0.06277207154998153, 0.014735230567728103, 0.24066530889341478, 0.017241822190301088], [0.05962416985215949, 0.5471092077087795, 0.0417334169911848, 0.15928362923271033, 0.11950118923122219, 0.028706180538483027, 0.1389171758316361, 0.07601586401328263], [0.2619226105211863, 0.4817824905661847, 0.24192313170044227, 0.09170706335093463, 0.09052537250418409, 0.3642577991681853, 0.6768499660556688, -0.22257799297153125], [0.23655239393059876, 0.5094019293944585, 0.22984246159157856, 0.07670354255394725, 0.07390201376193968, 0.5624140713279896, 1.0, 1.0], [0.2525459324350966, 0.3579698150976626, 0.19763530133345586, 0.07290890413125423, 0.07065967813516462, 0.224624625302545, 0.5497284453496266, 0.0594084375961582], [0.24372718835484417, 0.3823923051979892, 0.19542511721497244, 0.06684530056106534, 0.06300485640464787, 0.19704118415436664, 0.49660556687033264, 0.4093337110671792], [0.3001203575429692, 0.5020518158084821, 0.2808597761551712, 0.0907501566245056, 0.08311051186035512, 0.4707785081086301, 0.9609640190088257, -0.02479653404793693], [0.5553006478548456, 0.3963751209296349, 0.5521894056376119, 0.10040795569413238, 0.10481372414210045, 0.9699288006994162, 0.47522063815342847, -5.875498790878059], [0.8409626016807268, 0.4358363204164185, 0.8846115707902636, 0.231985813932135, 0.25100820929950546, 1.0, 0.3257807196198235, -6.192625007957869], [0.6505394508214833, 0.601481795709304, 0.6156717389467581, 0.20032772053500805, 0.1880998358344729, 0.8311405605498298, 0.7389680923285812, -4.699454612489869], [0.9731833756113974, 0.5771138422996525, 1.0, 0.14216353375190308, 0.1332285814188439, 0.9472609610375593, 0.49083503054989824, -5.823050782917777], [0.690898970043693, 0.6180282752202009, 0.6756898556603982, 0.23916797748289673, 0.24182391903602055, 0.6434080453743202, 0.4596062457569587, -3.4718829043892487], [1.0, 0.3398366858976391, 0.7352698337182155, 1.0, 1.0, 0.717685814283452, 0.22063815342837748, -3.384593265268097], [0.4260465701689263, 0.34194867769632836, 0.35715988317299047, 0.7201756668543021, 0.6970773219883378, 0.7165412725587308, 0.23073659198913787, -3.8541223959564994], [0.4031192789075803, 0.5538244403703657, 0.40686133317924583, 0.9615354030688323, 0.972623546810315, 0.8079452801773019, 0.2953156822810591, -3.6795196257542138], [0.4837646506109135, 0.42595341065640907, 0.46217606586597454, 0.8603452736261372, 0.8801135542630651, 0.724292466824971, 0.629327902240326, -3.8406012497506214], [0.36615487646488876, 0.3605862142158899, 0.29106650687691266, 0.666015158950817, 0.6368920968150436, 0.7519497818655793, 0.29540054310930075, -3.1317440244841364]], 'class_labels': [0, 0, 0, 0, 0, 1, 1, 1, 1, 1, 2, 2, 2, 2, 2, 3, 3, 3, 3, 3]}

Selecting a good set of features is a really important stage for training an effective classification system. For now we are simply loading the selected set of features without explaining the real reason for choosing them (we strongly recommend to read the content of Rock, Paper or Scissor Game - Train and Classify [Volume 3] | Feature Selection ).

In order to understand the relevance of selecting a valuable set of features (and how this choice can affect the performance of our classifier), our last volume of "Classification Game" ( Rock, Paper or Scissor Game - Train and Classify [Volume 5] | Performance Evaluation ) can be a useful resource to go deeper into this question !

Set of Features A

  • $\sigma_{emg\,flexor}$
  • $zcr_{emg\,flexor}$
  • $\sigma_{emg\,flexor}^{abs}$
  • $\sigma_{emg\,adductor}$
  • $\sigma_{emg\,adductor}^{abs}$
  • $\sigma_{acc\,z}$
  • $max_{acc\,z}$
  • $m_{acc\,z}$

2 - Storage of content of the dictionary into individual variables

In the previously mentioned internal step (of loading the dictionary created on Rock, Paper or Scissor Game - Train and Classify [Volume 3] | Feature Selection ) data was stored in features_dict variable.

In [4]:
training_examples = features_dict["features_list_final"]
class_training_examples = features_dict["class_labels"]

Checkpoint !!! Currently all the information needed for training our classifier is stored on the following variables:

  • training_examples (list where each entry is a sublist representative of a training example, containing the respective feature values for set A )
  • class_training_examples (list where each entry contains the class label linked to each training example)

3 - Creation of a "k-Nearest Neighbour" scikit-learn objects

We use the predefined $k$ (number of neighbours) which is 5.

In [5]:
# k-Nearest Neighbour object initialisation.
knn_classifier = KNeighborsClassifier()

4 - Begin the training stage of classifier (fitting model to data)

In [6]:
knn_classifier.fit(training_examples, class_training_examples)
Out[6]:
KNeighborsClassifier(algorithm='auto', leaf_size=30, metric='minkowski',
           metric_params=None, n_jobs=None, n_neighbors=5, p=2,
           weights='uniform')

The following interactive plot ensures a deep understanding about the class separation provided by each pair of dimensions/features.

In [7]:
import numpy as np
from numpy import array

from bokeh.layouts import layout
from bokeh.models import CustomJS, Slider, Select, ColumnDataSource, WidgetBox
from bokeh.plotting import figure, show

tools = 'pan'
features_identifiers = ["std_emg_flexor", "zcr_emg_flexor", "std_abs_emg_flexor", "std_emg_adductor", "std_abs_emg_adductor", "std_acc_z", "max_acc_z", "m_acc_z"]

def slider():
    dict_features = {}
    for feature_nbr in range(0, len(training_examples[0])):
        values_feature = array(training_examples)[:, feature_nbr]
        
        # Fill of dict.
        for class_of_example in range(0, len(class_training_examples)):
            current_keys = list(dict_features.keys())
            if class_training_examples[class_of_example] not in current_keys:
                dict_features[class_training_examples[class_of_example]] = {}
            
            current_sub_keys = list(dict_features[class_training_examples[class_of_example]].keys())
            if features_identifiers[feature_nbr] not in current_sub_keys:
                dict_features[class_training_examples[class_of_example]][features_identifiers[feature_nbr]] = []
            
            dict_features[class_training_examples[class_of_example]][features_identifiers[feature_nbr]] += [values_feature[class_of_example]]
            
            # Add of two additional keys that will store the data currently being ploted.
            if feature_nbr == 0:
                if "x" not in current_sub_keys:
                    dict_features[class_training_examples[class_of_example]]["x"] = []
                dict_features[class_training_examples[class_of_example]]["x"] += [values_feature[class_of_example]]
            elif feature_nbr == 1:
                if "y" not in current_sub_keys:
                    dict_features[class_training_examples[class_of_example]]["y"] = []
                dict_features[class_training_examples[class_of_example]]["y"] += [values_feature[class_of_example]]
        
    source_class_0 = ColumnDataSource(data=dict_features[0])
    source_class_1 = ColumnDataSource(data=dict_features[1])
    source_class_2 = ColumnDataSource(data=dict_features[2])
    source_class_3 = ColumnDataSource(data=dict_features[3])

    plot = figure(x_range=(-1.5, 1.5), y_range=(-1.5, 1.5), tools='', toolbar_location=None, title="Pairing Classification Dimensions")
    bsnb.opensignals_style([plot])
    
    # Define different colours for points of each class.
    # [Class 0]
    plot.circle('x', 'y', source=source_class_0, line_width=3, line_alpha=0.6, color="red")
    # [Class 1]
    plot.circle('x', 'y', source=source_class_1, line_width=3, line_alpha=0.6, color="green")
    # [Class 2]
    plot.circle('x', 'y', source=source_class_2, line_width=3, line_alpha=0.6, color="orange")
    # [Class 3]
    plot.circle('x', 'y', source=source_class_3, line_width=3, line_alpha=0.6, color="blue")

    callback = CustomJS(args=dict(source=[source_class_0, source_class_1, source_class_2, source_class_3]), code="""
        // Each class has an independent data structure.
        var data_0 = source[0].data;
        var data_1 = source[1].data;
        var data_2 = source[2].data;
        var data_3 = source[3].data;
        
        // Selected values in the interface.
        var feature_identifier_x = x_feature.value;
        var feature_identifier_y = y_feature.value;
        console.log("x_feature: " + feature_identifier_x);
        console.log("y_feature: " + feature_identifier_y);
        
        // Update of values.
        var x_0 = data_0["x"];
        var y_0 = data_0["y"];
        for (var i = 0; i < x_0.length; i++) {
            x_0[i] = data_0[feature_identifier_x][i];
            y_0[i] = data_0[feature_identifier_y][i];
        }
        
        var x_1 = data_1["x"];
        var y_1 = data_1["y"];
        for (var i = 0; i < x_1.length; i++) {
            x_1[i] = data_1[feature_identifier_x][i];
            y_1[i] = data_1[feature_identifier_y][i];
        }
        
        var x_2 = data_2["x"];
        var y_2 = data_2["y"];
        for (var i = 0; i < x_2.length; i++) {
            x_2[i] = data_2[feature_identifier_x][i];
            y_2[i] = data_2[feature_identifier_y][i];
        }
        
        var x_3 = data_3["x"];
        var y_3 = data_3["y"];
        for (var i = 0; i < x_3.length; i++) {
            x_3[i] = data_3[feature_identifier_x][i];
            y_3[i] = data_3[feature_identifier_y][i];
        }
        
        // Communicate update.
        source[0].change.emit();
        source[1].change.emit();
        source[2].change.emit();
        source[3].change.emit();
    """)

    x_feature_select = Select(title="Select the Feature of Axis x:", value="std_emg_flexor", options=features_identifiers, callback=callback)
    callback.args["x_feature"] = x_feature_select
    
    y_feature_select = Select(title="Select the Feature of Axis y:", value="zcr_emg_flexor", options=features_identifiers, callback=callback)
    callback.args["y_feature"] = y_feature_select

    widgets = WidgetBox(x_feature_select, y_feature_select)
    return [widgets, plot]

l = layout([slider(),], sizing_mode='scale_width')

show(l)

5 - For classifying a new "test" example (with unknown class) it will only be necessary to give an input to the classifier, i.e., a list with the features values of the "test" example

In [8]:
# A list with 8 arbitrary entries.
test_examples_features = [0.65, 0.51, 0.70, 0.10, 0.20, 0.17, 0.23, 0.88]

# Classification.
print("Returned Class: ")
print(knn_classifier.predict([test_examples_features]))

# Probability of Accuracy.
print("Probability of each class:")
print(knn_classifier.predict_proba([test_examples_features]))
Returned Class: 
[1]
Probability of each class:
[[0.4 0.6 0.  0. ]]

There is a clear doubt between class "0" ("No Action") and class "1" ("Paper"), with 40 % and 60 % of accuracy probability, respectively.

With the steps described on the current volume of "Classification Game", our classifier is trained and ready to receive new examples and classify them immediately.

There is only one remaining task, that will be briefly explained on the final volume , consisting in the objective evaluation of the classifier quality.

We hope that you have enjoyed this guide. biosignalsnotebooks is an environment in continuous expansion, so don"t stop your journey and learn more with the remaining Notebooks !

In [9]:
from biosignalsnotebooks.__notebook_support__ import css_style_apply
css_style_apply()
.................... CSS Style Applied to Jupyter Notebook .........................
Out[9]: